2Design wind pressure#
2.1General#
Earlier versions of this Design Guide dating back to 1993 adopted a strategy of using an appropriate probability of exceedance of the wind speed to derive support structure sizing that was considered acceptable to both structure 'design life' and road safety (collision). The chance of exceedance in 50-year and one-year return periods was 96% and 6.5% respectively. This updated Edition derives similar design wind pressures, determined in accordance with the current Australian Standards and with the application of a pressure reduction factor, R.
The following sections outline the structural assumptions made in this Guide. The design process is based on AS/NZS 1170.2-2011.
2.2Safe failure mode#
The design strategy is based on a safe failure mode of support post yielding and bending prior to failure of the sign face and its attachment to the posts. To ensure that signs are not blown off before the poles bend, aluminium stiffener rails and sign face are designed to accommodate peak edge pressures generated by the critical 45-degree wind approach angle, Terrain Category 2 (fully exposed) and with an additional safety factor of 1.5 applied to the post design pressure.
2.3Importance Level#
Importance Level 1 in accordance with AS/NZS 1170:0 Appendix F is used on the basis of 'small or moderate' economic consequence and safe failure mode with failure unlikely to endanger human life. A design working life of 25-year design life is considered appropriate and this yields an annual probability of exceedance of 1 in 100 (1/100) for cyclonic and non-cyclonic wind speed.
2.4Pressure reduction factor#
A pressure reduction factor, R = 0.5, is applied to the ultimate support post design pressure derived in accordance with AS/NZS 1170.2-2011. This factor is applied to the resultant pressure derived from wind speed and drag co-efficient.
2.5Regions#
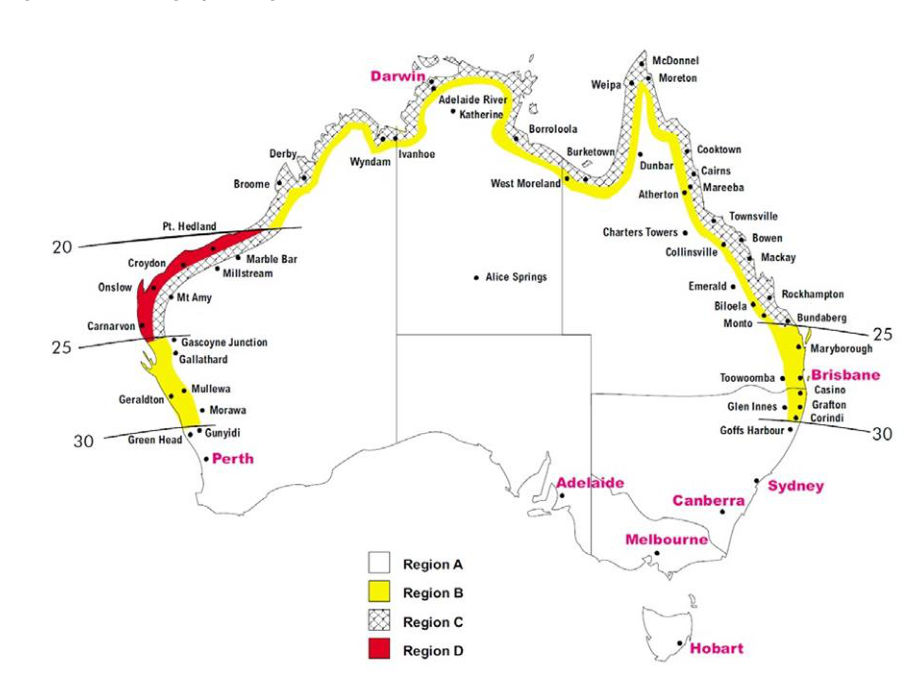
Signs in the different geographic regions defined in AS/NZS 1170.2 (A, B, C and D) are designed for the wind speed related to that region. Region D is included to facilitate design charts for Exposed Region C locations (refer to Section 2.6 following).
2.6Terrain Category#
To simplify the design procedure, design charts are derived to suit general exposure as applicable to Terrain Category 3 (terrain with numerous closely spaced obstructions 3m to 5m high). To cater for exposed locations (Terrain Category 2 – open terrain, grasslands with few, well scattered obstructions), the design method calls for use of charts applicable to the next higher wind region.
2.7Gantries and cantilevers#
The design philosophy outlined in sections 2.2, 2.3 and 2.4 does not apply to sign gantries or cantilevers that extend over traffic lanes, which are excluded from the Guide. These signs should be designed in accordance with the Design Criteria for Bridges and Other Structures.
2.8Special locations#
High-risk areas likely to be exposed to high wind speeds regularly should be identified and the risk assessed. This risk can be reduced by the use of the exposed category (Category 2 of AS/NZS 1170.2) or an increased section size. Typical locations that should be considered are:
- Houghton Highway (across water adjacent Moreton Bay)
- Gateway Bridge (high, exposed position)
- some sections of Gateway Arterial, adjacent to Brisbane Airport, and/or
- Gold Coast Highway at Kirra and other coastal positions.
2.9Selection of region and exposure#
For those locations not listed in Section 2.8, the following procedure for the selection of the appropriate Design Table is recommended:
- 1)Identify Region A, B, C – refer to Figure 2.1.
- 2)Consider whether or not the region is particularly exposed or at risk. If so, increase Region A to B, B to C, and C to D.
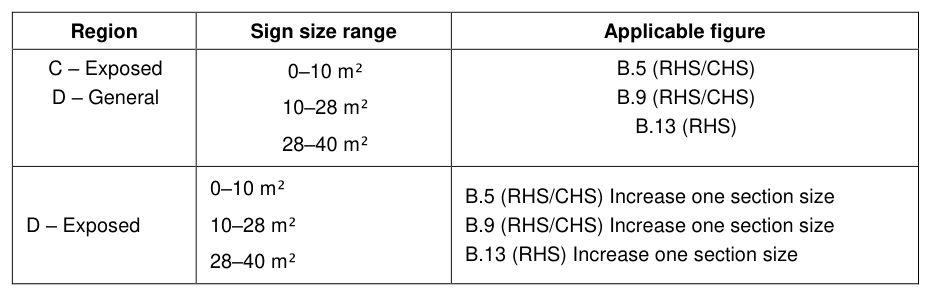
- 3)Refer to Table 2.1 to determine the appropriate figure. Figures B.2–B.13 can be found in Appendix B to this Guide.
Situations outside the scope of these tables, or standard sections, should be checked and designed by a structural engineer. Extrapolation of these tables is neither appropriate nor acceptable.
2.10Additional information#
The Traffic Engineering and Data Unit, Engineering and Technology Branch holds design calculations, which outline the basis for the design charts.
Based on various Australian Standards, assumptions have been made on the performance of the sign structure as a whole. Full scale structural testing is recommended to confirm these assumptions.
| Region | Sign size range | Applicable figure |
|---|---|---|
| A – General | 0–10 m² | B.2 (RHS/CHS) |
| A – General | 10–28 m² | B.6 (RHS/CHS) |
| A – General | 28–40 m² | B.10 (RHS) |
| A – Exposed | 0–10 m² | B.3 (RHS/CHS) |
| A – Exposed | 10–28 m² | B.7 (RHS/CHS) |
| A – Exposed | 28–40 m² | B.11 (RHS) |
| B – General | 0–10 m² | B.4 (RHS/CHS) |
| B – General | 10–28 m² | B.8 (RHS/CHS) |
| B – General | 28–40 m² | B.12 (RHS) |
| C – Exposed | 0–10 m² | B.5 (RHS/CHS) |
| C – Exposed | 10–28 m² | B.9 (RHS/CHS) |
| C – Exposed | 28–40 m² | B.13 (RHS) |
| D – General | 0–10 m² | B.5 (RHS/CHS) |
| D – General | 10–28 m² | Increase one section size |
| D – General | 28–40 m² | B.9 (RHS/CHS) |
| D – Exposed | 0–10 m² | Increase one section size |
| D – Exposed | 10–28 m² | B.13 (RHS) |
| D – Exposed | 28–40 m² | Increase one section size |